Product Name: Alteryx Designer (x64)
Product Version: 2022.3.1.450 Patch 2
Alteryx is a versatile data analytics platform, offering a comprehensive suite of tools for data preparation, blending, and advanced analytics. Its primary aim is to empower users with varying degrees of programming expertise to efficiently manipulate, cleanse, and transform data from diverse sources. The platform’s intuitive drag-and-drop interface enables users to construct custom analytical workflows by connecting pre-built modules, simplifying the process for beginners. Alteryx is compatible with a wide range of programming languages, data file types, and integrates seamlessly with databases and other data analytics systems. This functionality makes it a popular choice for those seeking visually appealing or custom datasets without sacrificing ease of use or feature richness.
In this tutorial we’ll create and complete a basic Alteryx Workflow,
- Data collection
- Data integration
- Data cleansing
- Data serialization
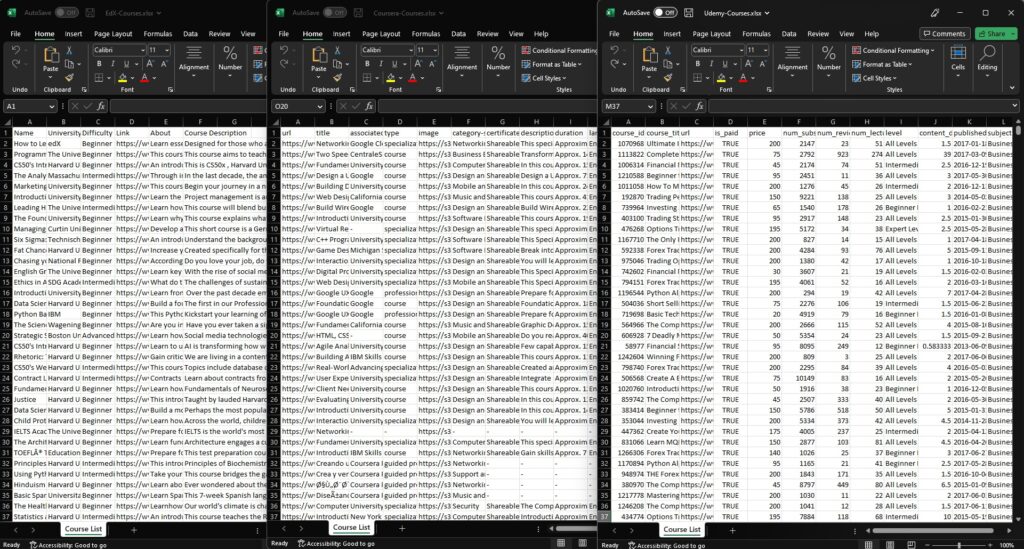
For this tutorial we’ll be combining datasets from three of the largest online learning platforms, so that by the end of this we’ll be able to export one complete dataset with all of the combined data. I’ve already downloaded the datasets that I need, there are tons of free and premium sources online.
Data collection
Obtain datasets
For this example I’ll combine data based on online courses from multiple sources, so that by the end of this we’ll be able to export one complete dataset with all of the combined data. I’ve already downloaded the datasets that I need, there are tons of great free and premium sources online.
These can come in various formats, e.g. .csv, .xlsx, db connections and more.
Create workflow
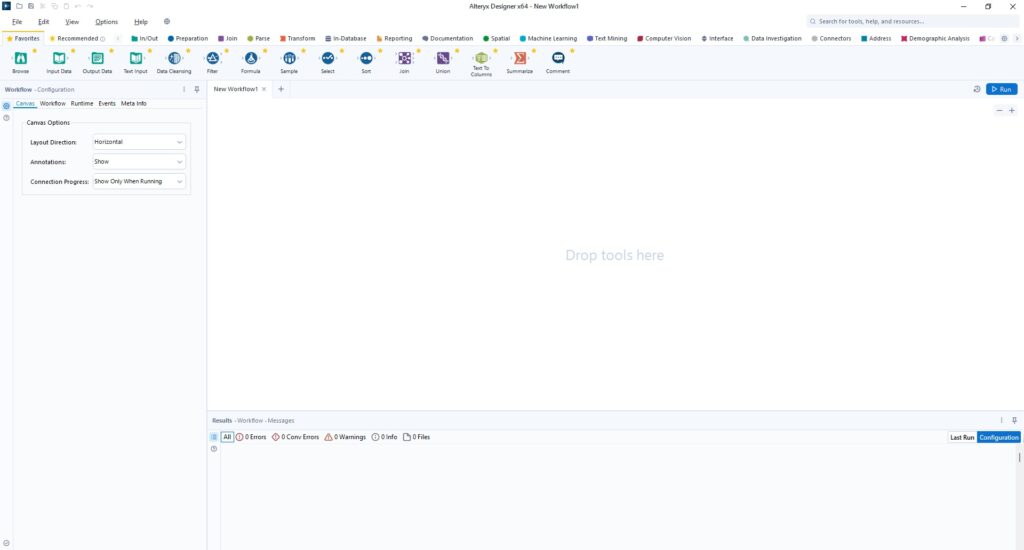
Now lets go ahead and create a workflow in Alteryx:
Click (File -> New Workflow).
Do it again but hit save this time (File -> Save).
You now have an empty workflow, it will adapt the name of the file by default.
Input data
Now that we have a workflow, lets bring in our data.
Add and configure an Input Data tool from In/Out tab for every dataset.

Attach a Browse tool from In/Out tab for every data source to allow viewing data on the run cycle.
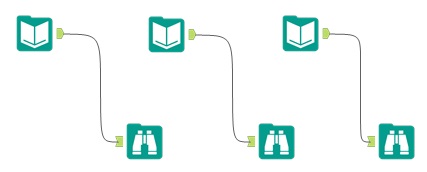
Click (blue Run button, in the top right corner).
Now by selecting any of the Browse tools, you can see the results of that dataset.
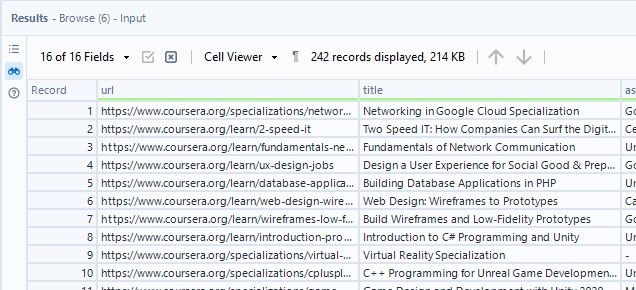
Select desired fields
Now that we’ve confirmed that we can view the contents of each dataset, it’s time that we go ahead and start working with the data. A good place to start is by selecting only the data that we need from each dataset. This will save us processing power and loading time within later parts of the workflow, as well as being easier to work with.
Replace each Browse tool with the Select tool from Preparation tab.
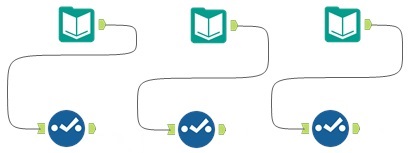
For our purpose we just want the (title) from each dataset.
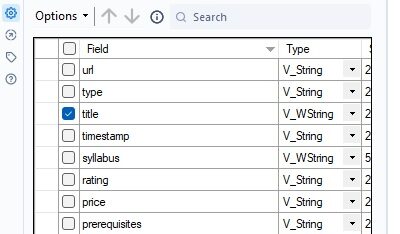
Scroll to the right in this Select window and you’ll find the Rename Column. Since we’ll be combining multiple datasets, it may be useful for us to have a way to track which each title comes from. Go ahead and give the column a name something like “DATASETNAME_title”.
(Note: You’ll have as many opportunities to rename these as you want. This can be useful to have a different column name while traversing the workflow and a more user friendly one at the end).
Data integration
Join data
Now lets go ahead and combine the selected data from every dataset.
Add a Join tool from the Join tab and connect all of the Select tools to it.
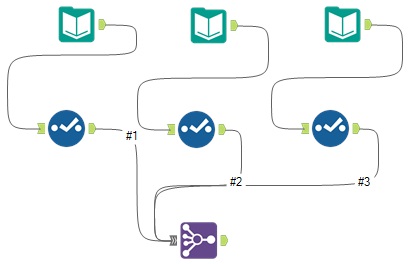
Configure it to the (Join by Specific Fields) option.
Set the Field Outputs to the data that you’re carrying over (e.g. title).
Transpose data
Now instead of having a column identify the dataset source (e.g. DATASETNAME_title), we’ll want have this as a field inside each record. This way we’ll have this identifier along with its value inside each record so that we can tell which dataset this course title case from.
Attach a Transpose tool from the Transform tab to the Join tool.
Set the Data Columns to the data you’re carrying over (e.g. title).
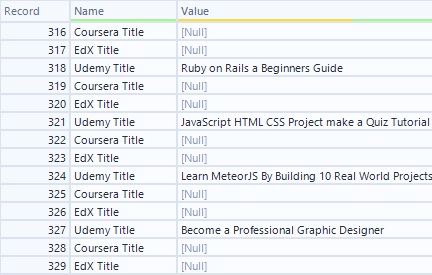
Now verify that the restructuring was successful (column name, and column value) for each course.
(Note: Null entries are normal at this point)
Data cleaning
Cleanse, filter, and select data
Now we’ll want to cleanse our data of entirely null rows and columns, as well as setting null to empty on strings and cleansing whitespace, tabs, and breaks. It’s a simple task and very easy to do with one tool.
Attach a Data Cleansing tool from the Preparation tab with the previously mentioned configuration.
This is a useful formatting tool, one common oversight is that it doesn’t clean partially null records.
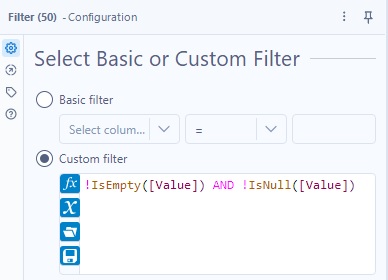
Let’s do a quick custom filter that for this, these are highly customizable and provide great utility.
Append a Filter tool from Preparation tab to the Data Cleansing tool with the following configuration:
End of workflow cleanup
At this point we’re ready to export the data, as we should have the expected output structure.
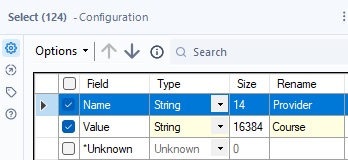
But one thing that can help both aesthetics and functionality is finalizing your column names.
Once again, append a Select tool and configure the Rename column to whatever you prefer.
Data serialization
Export data
Now we should have our completed dataset. So let’s go ahead and export it.
Append the Output Data tool from the In/Out tab, and then click Set Up a Connection.
Now select your desired output format, I’ll choose (.xlsx) for this.
Click (blue Run button, in the top right corner).
Now check the selected save location for the output file.

Within it you’ll see your combined dataset with all of the workflow changes.
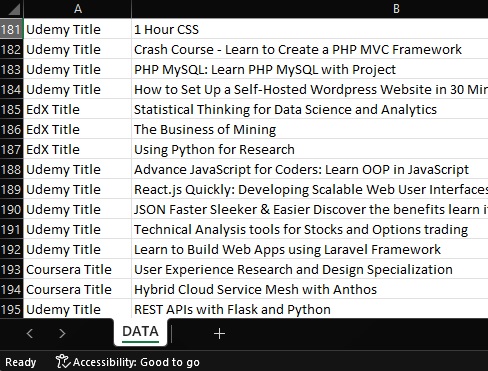
Conclusion:
Great job, you now have the groundwork for a fully functional Alteryx Workflow!
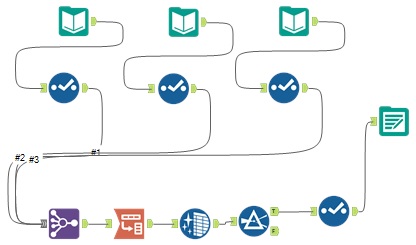
You can combine any number of data sources, customize the data and then create your own insightful datasets. There is more than one way to complete a task, and you have the freedom to sequence them in whatever way works the best for you and your project. Don’t stop here though, there’s many more tools built into Alteryx and we’ve barely just scratched the surface!
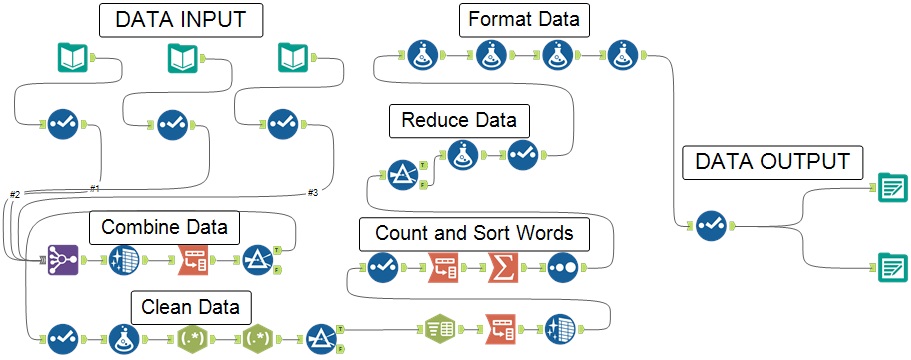
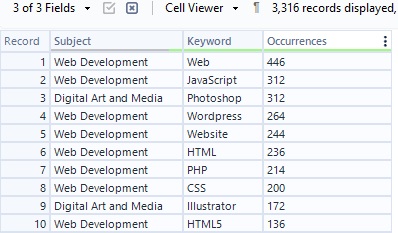
BONUS:
I made some modifications! Instead of just outputting all of the Course Titles and the Course Providers, I changed the workflow to count the number of times a word occurred in the Course Titles and Sort from Largest to Smallest to find out which technology “keywords” were repeated the most. Along with the .xlsx file, I also have it set to output a .hyper file to work with Tableau. This is just an example of where you can go from our tutorial.
